Volio
VolioFood cost percentage: formula and menu prices
Food cost percentage is the cost of the food divided by the sales it made. The formula per plate and per month, worked out, and why online targets disagree.
Food cost percentage is what the food cost you divided by what it sold for, times 100. For one dish, divide the plate cost by the menu price: a plate that costs €5.00 to make and sells for €19.00 runs at 26.3%. For a month, it is (opening stock + purchases − closing stock) ÷ food sales.
Use the free food cost calculator to get each dish’s percentage and the price that meets a target you choose. Below is the same arithmetic by hand, and three places it goes wrong: yield, portions and the stock count.
The formulas, per plate and per period
Per plate: food cost % = plate cost ÷ menu price × 100.
Reverse, to set a price: menu price = plate cost ÷ target food cost %. A €5.00 plate at a 28% target is €5.00 ÷ 0.28 = €17.86. Round it to a price that reads well on the menu.
For a period: food cost % = (opening stock + purchases − closing stock) ÷ food sales × 100.
The BC cook training textbook calls the top line the basic cost of food, then takes out what didn’t produce a sale: staff meals, food used for promotions and food sent to the bar as snacks. Wine or spirits the kitchen takes from the bar for cooking go the other way and are added to food cost. What is left is the net food cost.
Plate costs say what the food should have cost; the month’s figure says what it did cost. Watch the gap.
Costing a plate, with yield
Take pan-fried salmon with crushed potatoes, green beans and beurre blanc, sold at €19.00.
The salmon comes as a side at €18.00 a kilo. A 1.5 kg side gives 1.2 kg of portions once the skin, pin bones and belly trim are off. That is a yield of 1.2 ÷ 1.5 = 80%, and it changes the price of what goes on the plate: €18.00 ÷ 0.80 = €22.50 per usable kilo. The textbook’s version is the same sum: edible weight ÷ purchased weight × 100 = yield %.
| Component | Cost |
|---|---|
| Salmon, 160 g at €22.50/kg | €3.60 |
| Crushed potatoes, 200 g | €0.30 |
| Green beans, 80 g | €0.45 |
| Beurre blanc, 40 ml | €0.40 |
| Lemon and herbs | €0.15 |
| Oil, butter and salt for cooking | €0.10 |
| Plate cost | €5.00 |
€5.00 ÷ €19.00 = 26.3%, and the dish leaves €14.00 a plate. That €14.00 is its contribution margin, the number menu engineering ranks dishes by.
Cost the salmon at the invoice price instead and it comes to €2.88. The plate drops to €4.28 and the percentage to 22.5%. Skipping the yield makes the dish look 3.8 points cheaper than it is, €0.72 on every plate. Meat that shrinks in the oven needs one more step: weigh it after cooking as well, because what you can slice is less than what went in.
A month’s food cost, worked out
| Line | Amount |
|---|---|
| Opening stock, counted on the last night of last month | €6,200 |
| + Food purchases this month, less credit notes | €14,800 |
| − Closing stock, counted on the last night of this month | €5,600 |
| = Basic cost of food | €15,400 |
| − Staff meals | €500 |
| = Net food cost | €14,900 |
| Food sales this month | €48,500 |
| Food cost % | 30.7% |
€14,900 ÷ €48,500 = 0.307, so 30.7%.
Now the check. Multiply each dish’s plate cost by the number the till says it sold and add them up. Say that comes to €13,580, which is 28.0% of food sales. The kitchen used €1,320 more food than the plates account for, 2.7 points of sales. The gap is some mix of waste, portions that grew, comps nobody wrote down, stock that walked out and plate costs that are out of date. One month’s gap is a hint; the same gap three months running is a problem to find.
What a good food cost percentage is
The National Restaurant Association’s 2025 Restaurant Operations Data Abstract, built on data from more than 900 US operators, puts food and non-alcohol beverage costs at a median of 32.0% of sales for full-service restaurants in 2024, and 32.4% for limited-service (published 10 September 2025). Split by size, full-service operators with $2 million or more in yearly sales had a median of 31.0%, and those below $2 million 33.7% (published 16 October 2025). The Association links the difference to economies of scale.
Read those figures with care. They are US medians, they include soft drinks, and the articles don’t say whether “sales” means all sales or food sales. The Association itself says the data are “not intended to represent standards or goals for individual restaurants”.
Your own number moves for reasons a median can’t see. A steakhouse buys dearer raw material than a pizzeria and charges for it. A high-priced room can run a lower percentage on the same plate. A bigger portion raises it. Volume helps too, as the Association’s split by sales shows. So set your target from your own plate costs, then watch the gap between that target and the monthly number.
What moves it, and the mistakes owners make
- Portions that grow. A 160 g salmon portion cut at 190 g costs 30 g × €22.50/kg = €0.675 more each time. On 300 plates a month that is €202.50, from one dish.
- Plate costs nobody updates. Supplier prices move. Re-cost the dishes that sell most whenever a big invoice changes.
- No stock count. Purchases ÷ sales swings with the day the deliveries land. Count on the same night each month, in the same order, and value the stock the same way each time.
- Mixed invoices. Drinks, takeaway packaging and cleaning products on a food invoice inflate the number. Keep them out, or keep them in every month, but decide once.
- Hidden staff meals and comps. Write them down, then take them out of food cost as the textbook does.
- Menu mix. Sell more steak and less risotto and the percentage can rise while the money left over rises too. Judge dishes by margin as well as by percentage.
- Price rises. A higher menu price lowers the percentage without the kitchen changing anything. Every printed menu then needs redoing, and a PDF menu behind a QR code has to be remade each time.
Where Volio fits
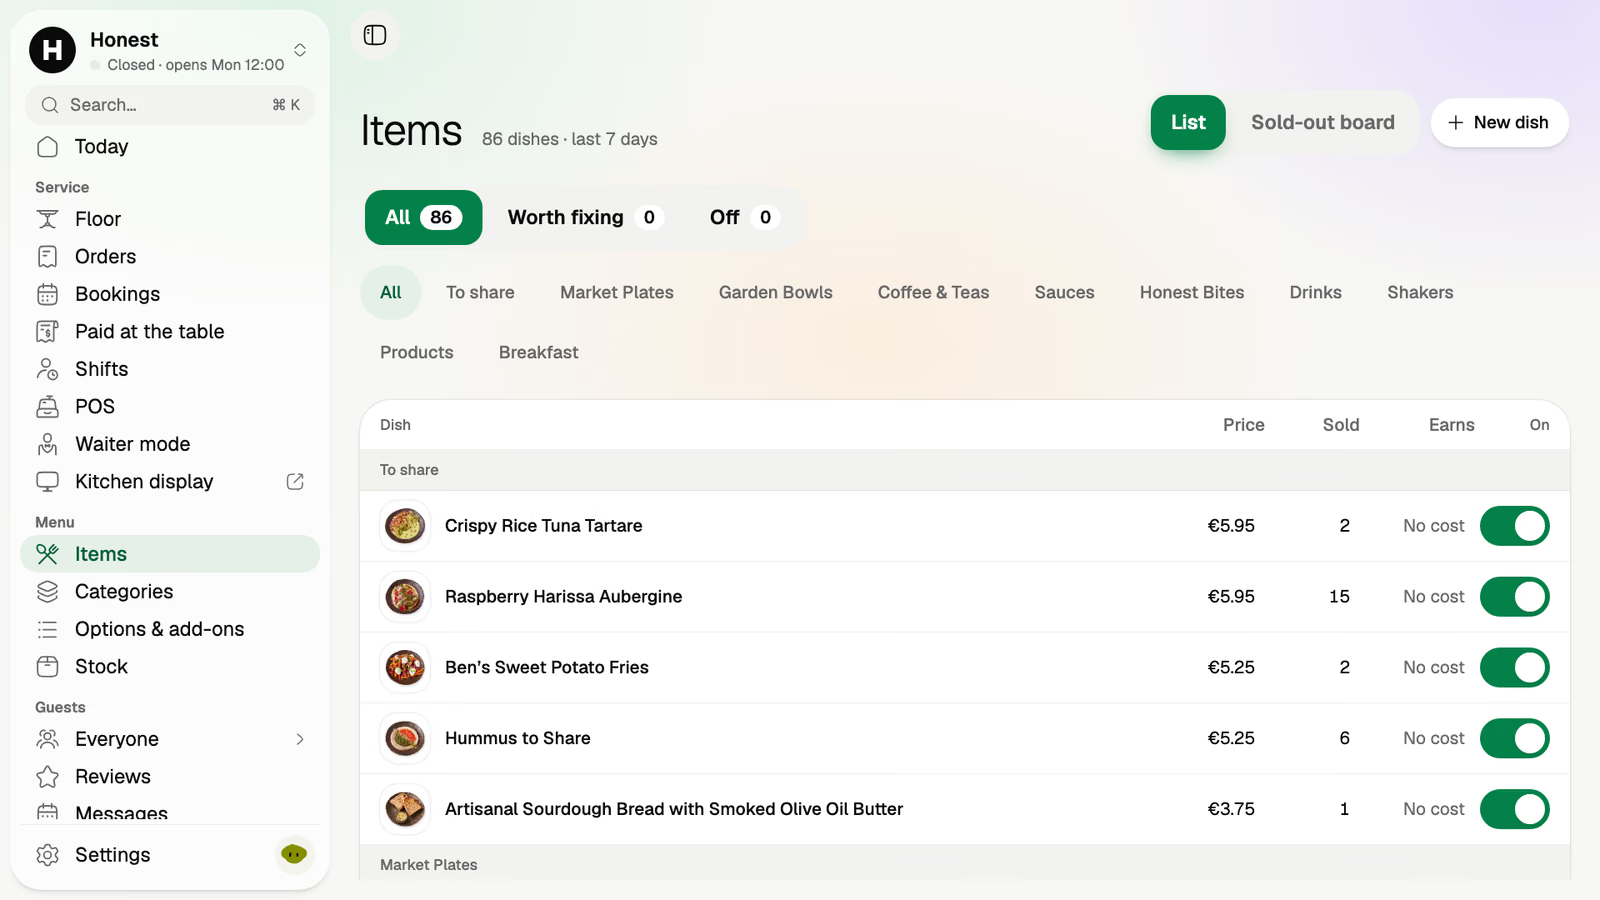
Volio’s back office shows takings by day and by hour, and items and margins with the best sellers, with export to Excel or CSV: the sales per dish the check above starts from. Stock and recipes are on the Pro plan (see the plans and prices). For the percentage and a price per dish, the food cost calculator takes the plate cost and the target.
The numbers are part of the back office. Volio launched in October 2026.
Sources
Read on 12 October 2026.
- BC Cook Articulation Committee, Basic Kitchen and Food Service Management, BCcampus open textbook, LibreTexts copy: “Monthly Food Costs”, “Yield Testing” and “Cooking Loss Test”
- National Restaurant Association, “Restaurant operators kept food cost ratios in check in 2024” (10 September 2025): restaurant.org
- National Restaurant Association, “Higher volume restaurants reported lower food cost ratios in 2024” (16 October 2025): restaurant.org