Volio
VolioMenu engineering: the four boxes, worked out
Menu engineering sorts each dish by what it earns per plate and how often it sells: stars, plowhorses, puzzles and dogs. The method on a six-dish menu.
Menu engineering sorts the dishes in one section of your menu by two numbers: the contribution margin (menu price minus the food cost of the plate) and how often each dish sells. A dish is popular if it sells at least 70% of an equal share, and profitable if its margin is at or above the section’s average. Those two answers put every dish in one of four boxes: stars (both), plowhorses (popular, low margin), puzzles (high margin, rarely ordered) and dogs (neither).
The method comes from Michael Kasavana and Donald Smith at Michigan State University’s School of Hospitality Business, “circa 1982” in Kasavana’s own account. You need three numbers per dish for one period: price, plate cost and plates sold. The free menu engineering calculator does the sums and draws the four boxes. Below is the same work by hand, on six mains.
How the method works
Work on one section at a time: mains against mains, starters against starters. A €7 soup and a €29 steak are not competing for the same order.
- Contribution margin = menu price − plate cost. The plate cost is the dish as served: the protein after trimming, the sides, the sauce, the garnish. Kasavana says the item cost should ideally also take in wasted product, in-house prep labour and packaging; most owners start with food alone, and so does the example below. If you have no plate costs yet, the food cost percentage guide shows how to build one.
- Popular or not. Divide 100% by the number of dishes in the section to get an equal share, then take 70% of it. Kasavana writes it as 1 / N × 70%, where N is the number of items. With 8 mains the equal share is 12.5% and the line is 8.75%. A dish whose share of the section’s plates is at or above the line counts as popular, so a dish selling a little under an even share still makes it.
- Profitable or not. Add up the margin from every plate sold in the section and divide by the number of plates. That is the average contribution margin, and it is weighted by sales: a dish sold 110 times counts for more than one sold 30 times. A dish at or above the average counts as profitable.
A worked example: six mains over four weeks
A bistro sold 400 mains in four weeks. Prices, plate costs and the count from the till:
| Dish | Price | Plate cost | Margin | Sold | Share | Box |
|---|---|---|---|---|---|---|
| Burger | €16.00 | €5.20 | €10.80 | 110 | 27.5% | Plowhorse |
| Chicken schnitzel | €18.00 | €4.50 | €13.50 | 95 | 23.8% | Star |
| Mushroom risotto | €17.00 | €3.40 | €13.60 | 90 | 22.5% | Star |
| Sea bream | €24.00 | €9.60 | €14.40 | 40 | 10.0% | Puzzle |
| Steak frites | €29.00 | €13.00 | €16.00 | 30 | 7.5% | Puzzle |
| Vegan bowl | €15.00 | €4.50 | €10.50 | 35 | 8.8% | Dog |
The popularity line. Six dishes, so the equal share is 100% ÷ 6 = 16.7%, and 70% of that is 11.7%. On 400 plates that is about 47 plates. The burger, the schnitzel and the risotto clear it. The sea bream, the steak and the vegan bowl don’t.
The margin line. Multiply each margin by the plates sold and add them up: €1,188 + €1,282.50 + €1,224 + €576 + €480 + €367.50 = €5,118. Divide by 400 plates: an average of €12.80. The burger (€10.80) and the vegan bowl (€10.50) sit below it; the other four sit above.
Look again at two lines. The steak frites has the worst food cost percentage on the menu, 44.8%, and the best margin, €16 a plate. Judge the menu by food cost percentage and you would push the risotto (20%) and bury the steak, yet every steak sold leaves €2.40 more than every risotto to pay the team, the rent and you. And the burger, the dish the kitchen sends most, leaves €2 less than the average plate each time.
What to do with stars, plowhorses, puzzles and dogs
Kasavana’s short version: stars are retained, plowhorses repriced, puzzles repositioned on the menu and dogs removed. The BC cook training textbook gives more detail.
- Stars (schnitzel, risotto). Keep the portion and the garnish exactly as they are; the textbook’s words are “maintain the specifications of the item rigidly”. Put them where the eye lands first and let the floor recommend them. The textbook also suggests testing a slight price rise.
- Plowhorses (burger). Raise the margin without losing the crowd. A €1 rise, if the same 110 still sell, is €110 more over four weeks and takes the margin to €11.80: still a plowhorse, but closer. Or cost the plate down with a smaller portion of fries or a cheaper side. Move in small steps: the textbook says “Increase prices carefully and gradually.”
- Puzzles (sea bream, steak). They earn well and too few people order them. Move them up the page, describe them better, have servers mention them. The textbook also suggests a slightly lower price: at €27 the steak still leaves €14, above today’s €12.80 line. Don’t cut so far that it turns into a plowhorse.
- Dogs (vegan bowl). The obvious candidate to come off. Ask who orders it first. If it is your only vegan main, the table of four that booked because of it brings margin in on three other plates, and the matrix can’t see that. A better vegan dish in its place keeps those tables. A shorter menu also helps on the nights you are a cook down, as the post on running a short-staffed restaurant explains.
Every price change has to reach every place the price is printed. If the menu lives on paper, a PDF and a board by the door, that is three edits; the guide to putting a menu on a TV covers the options for the board.
Mistakes that put dishes in the wrong box
- Mixing sections. Put starters, mains and desserts in one table and cheap dishes look like dogs next to the steak, as the textbook warns with its dessert and lobster example.
- Ranking by food cost percentage. A low percentage on a cheap dish can leave less money than a high percentage on a dear one, as the steak shows.
- Old plate costs. Supplier prices move. A plate cost from last spring can keep a dish in a box it has already left. Re-cost before each run.
- A short or odd period. One week with a private party of 40 on a set menu tells you about the party. Kasavana’s example averages costs over a four-week cycle; use four weeks or more, and compare like with like.
- Dishes that weren’t on all period. A special that ran for ten days will look unpopular next to dishes that ran for 28. Leave it out or compare it over its own days.
- Reading the margin as profit. In this example the margin counts food only. A risotto stirred to order and a steak on the grill take different minutes from different stations, and the matrix doesn’t weigh that.
Where Volio fits
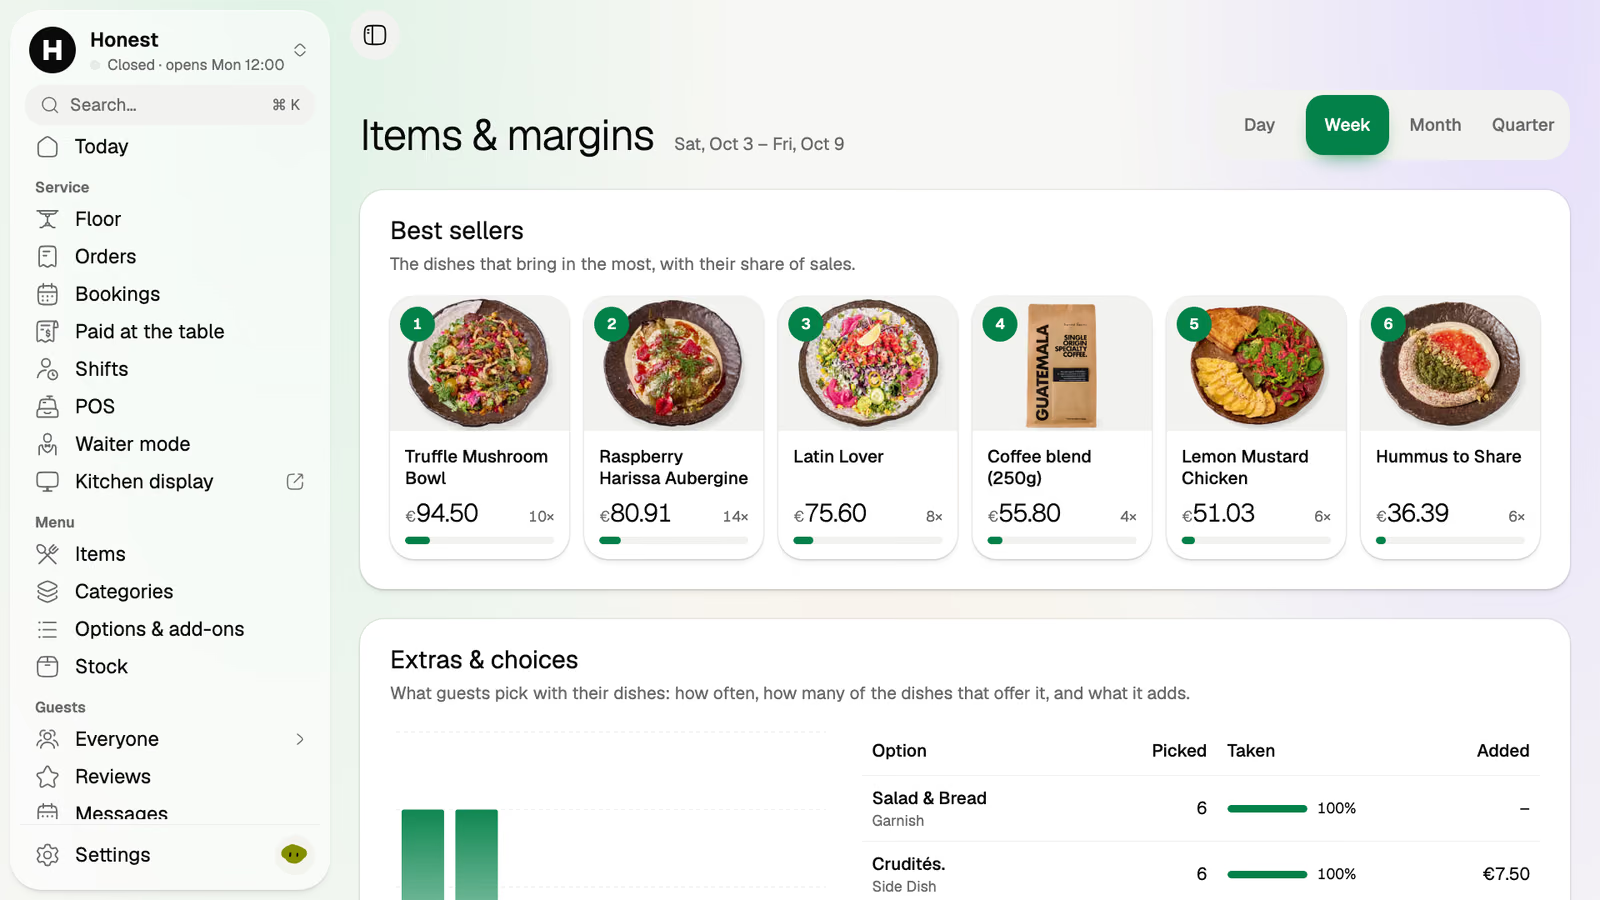
Volio’s back office shows takings by day and by hour, and items and margins with the best sellers, with export to Excel or CSV. That is where the plates-sold column starts. Put the counts with your plate costs in the menu engineering calculator and the four boxes follow.
The numbers are part of the back office. Volio launched in October 2026.
Sources
Read on 12 October 2026.
- Michael L. Kasavana, “The Power of Menu Engineering”, part one (8 April 2025) and part two (14 May 2025), American Hotel & Lodging Educational Institute: part one, part two
- BC Cook Articulation Committee, Basic Kitchen and Food Service Management, BCcampus open textbook, “The Principles of Menu Engineering”: workforce.libretexts.org